New in Foxhound 4: White-on-black and grey highlighting is now used instead of colors like this and this .
A white paper by Breck Carter
2016 11 15 - updated 2018 09 16
Introduction
Foxhound Versus The Alternatives
Hallmarks of Foxhound
Features...
The Foxhound Menu Page
The Monitor Page
The Sample History Page
The Connection History Page
Alerts
Schedules
Use Cases...
1: Runaway CPU Usage
2: Runaway Memory Usage
3: Large Deployments
A database monitor is a computer program that measures the activity of a database management system and displays those measurements in a meaningful way so you can see everything's OK... or quickly learn about problems and threats to performance and availability.
Foxhound 4 is a third-party database monitor for SAP® SQL Anywhere®. Here's how it works:
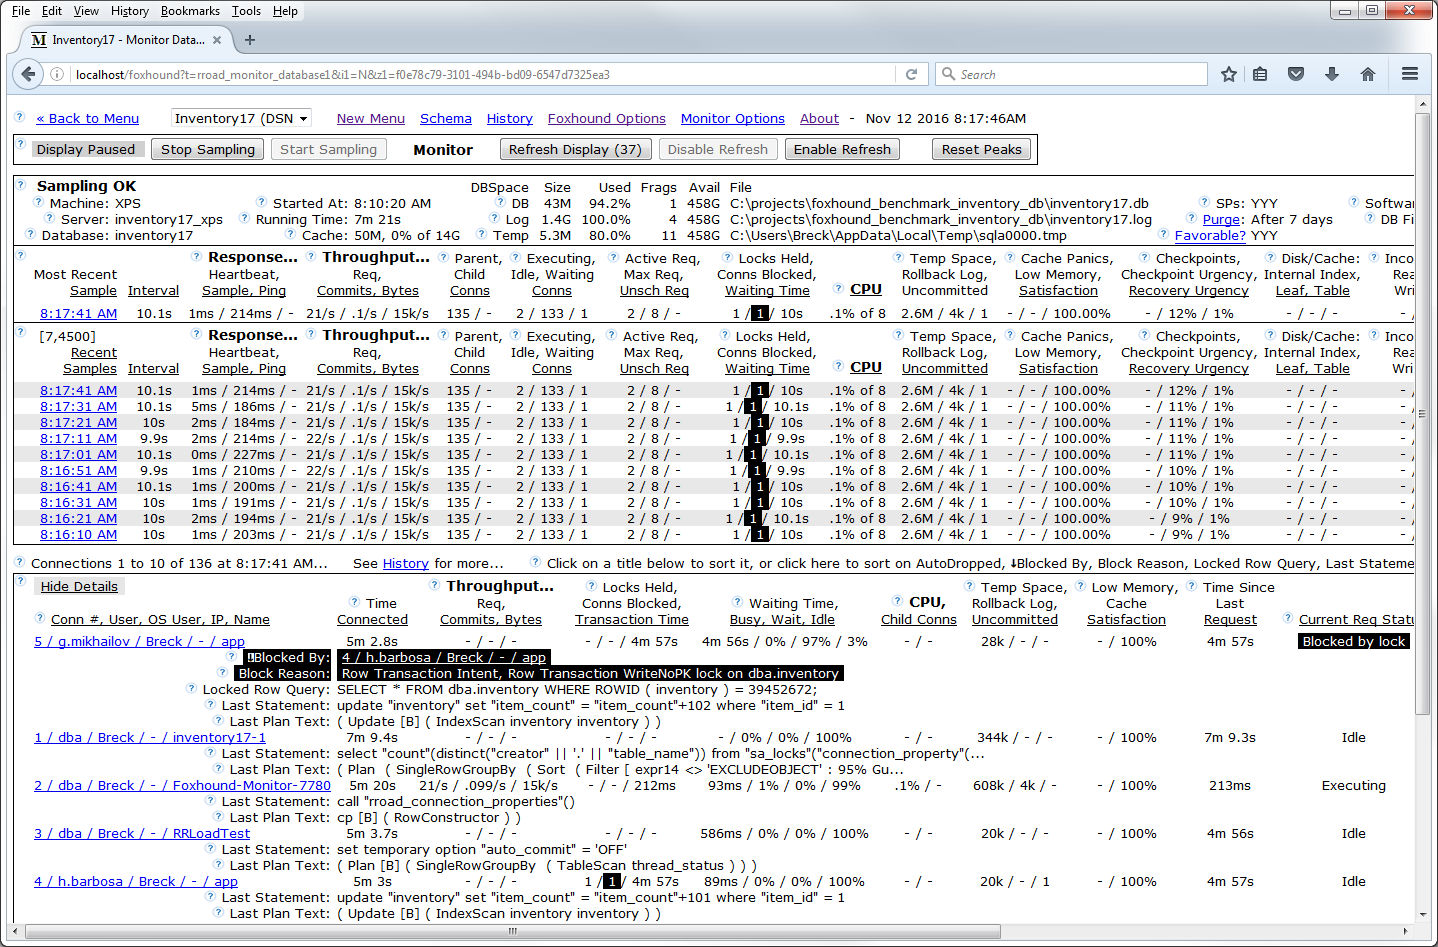
Figure 1 shows the Foxhound Monitor page for a lightly-loaded SQL Anywhere server with 135 connections, one of which is blocked by an uncommitted operation made by a long-running transaction on another connection.
Figure 1. The Foxhound Monitor Page Showing An Idle Server With One Blocked Connection
New in Foxhound 4: White-on-black and grey highlighting is now used instead of colors like this and this .
Table 1 compares Foxhound Version 4 with several alternative products:
Table 1. Comparing Foxhound 4 With Alternative Products
| Product 5 | SQL Anywhere Monitor 17 | Sybase Central Performance Monitor 16 1 | SQL Anywhere Cockpit 17 | DBConsole Utility 16 2 | Windows Performance Monitor | Foxhound 4 |
| Primary Purpose | Health and availability monitor | Performance monitor | Health, availability and performance monitor | Connection monitor | Performance monitor | Health, availability and performance monitor |
| Setup Required | A lot | Everything | Some | Some | Everything | Very little |
| Collection Interval | 30 sec default, 10 sec minimum | 1 sec fixed | Frequent | 4 sec default, 1 sec minimum | 1 sec default, 1 sec minimum | 10 sec fixed |
| Presentation | Graphs, Text | Graphs | Graphs, Text | Text | Graphs | Text |
| Implementation | Adobe Flash | Java | HTML5 | Native Windows | Native Windows | HTML |
| Historical Data | Limited | No | No | No | No | Yes |
| Connection History | No | No | No | No | No | Yes |
| Adhoc Reporting | No | No | No | No | No | Yes |
| SQL Anywhere Statistics | Some, Variable | All, Variable | All, Fixed | All, Variable | All, Variable | Some, Fixed |
| Peak Highlighting | No | No | No | No | No | Yes |
| Value-Added Calculations | No | No | No | No | No | Yes |
| Alerts | 9 point-in-time events | No | Some point-in-time events | No | No | 34 conditions |
| Alert "All Clear" | No | No | No | No | No | Yes |
| Alert Emails | Yes | No | No | No | No | Yes |
| Ping New Connections | No | No | No | No | No | Yes |
| Drop Connection | Manual | No | Manual | Manual | No | AutoDrop |
| Docs | Minimal | Minimal | Minimal | Minimal | Minimal | Extensive |
| Target Databases Supported | 11, 12, 16, 17 | 11, 12, 16 | 17 3 | 11, 12, 16 | 5.5, 6, 7, 8, 9, 10, 11, 12, 16, 17 | 6, 7, 8, 9, 10, 11, 12, 16, 17 4 |
| Target Hosts Supported | Local, Network | Local, Network | Local, Network | Local, Network | Local | Local, Network |
| MobiLink and Relay Server Support | Yes | No | No | No | No | No |
| What's Good? | Pretty | Free | Pretty | Free | Free | Businesslike |
| What Else? | Modal | Hideous | Modal | Basic | Hideous | Dense |
Footnotes:
1. The Sybase Central Performance Monitor is not available in SQL Anywhere 17.
2. The DBconsole Utility is not available in SQL Anywhere 17.
3. The SQL Anywhere Cockpit does support SQL Anywhere 16 databases running on SQL Anywhere 17.
4. Foxhound 4 does support SQL Anywhere 5.5 databases running on SQL Anywhere 6 and later versions.
5. The new SQL Anywhere Profiler 17 is omitted because it's complementary rather than comparable.Primary Purpose: This is how the products are advertised.
Setup Required: Both DBConsole and Foxhound let you "connect and go" to see something useful while the others require varying degrees of effort to get started.
Collection Interval: 10 seconds is tradeoff between accuracy and efficiency.
Presentation: Nobody's asking for graphs so they remain a low-priority item for Foxhound.
Implementation: How the presentation is implemented explains a lot about how a product looks and feels.
Historical Data: Only Foxhound provides random access to every measurement stored in the database.
Connection History: Only Foxhound lets you view the entire history of a single connection.
Adhoc Reporting: Only Foxhound recognizes that all your data belongs to you and should be accessible.
SQL Anywhere Statistics: Like the collection interval, Foxhound's choice of which statistics to gather is fixed.
Peak Highlighting: This is what Foxhound does instead of graphs.
Value-Added Calculations: Latency, Throughput, CPU % and many other values are derived from raw statistics.
Alerts: Events happen once, conditions go into and out of effect.
Alert "All Clear": It's important to know when an Alert condition is no longer in effect.
Alert Emails: The SQL Anywhere Monitor sends emails for Alerts, Foxhound also sends All Clear emails.
Ping New Connections: Only Foxhound checks that the target database is accepting new connections.
Drop Connection: Only Foxhound can automatically drop runaway connections.
Docs: The Foxhound Help includes dozens of performance tips.
Target Databases Supported: Foxhound support for Version 5.5 databases is fading but not gone.
Target Hosts Supported: The Windows Performance Monitor reports on the computer it's running on.
MobiLink and Relay Server Support: The SQL Anywhere Monitor is the only game in town for this.
What's Good? "If you had to use a single word to describe what you like about this product, what would it be?"
What Else? "Give me another word, this time describing what you don't like about this product."
Here's a list of Foxhound characteristics you can take advantage of:
Figure 2. Foxhound Hallmarks: Information At A Glance With Side-By-Side Guidance
The Menu page is Foxhound's home page. The DSN tab in Figure 3 lets you pick a target database from a drop-down list of ODBC DSNs and then click on the Monitor Database button.
Alternatively, the String tab in Figure 4 lets you create a DSN-less connection to a target database.
Figure 3. The DSN Tab on the Foxhound Menu Page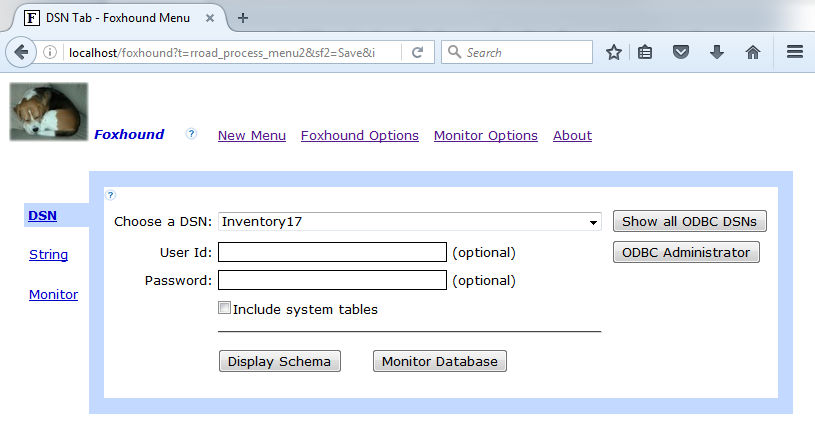
Figure 4. The String Tab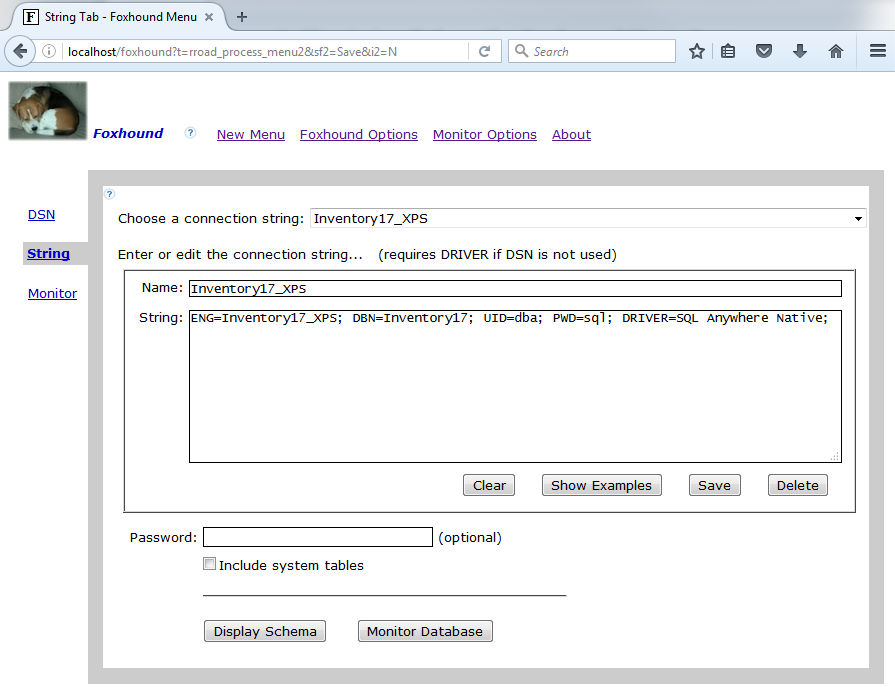
The Monitor page is automatically refreshed every 10 seconds to show a snapshot of current activity: the most recent 10 samples plus the most recent details of 10 connections.
Figure 5 shows a busy primary database in a SQL Anywhere 16 High Availability setup. One Alert has been issued: Alert #14 Unscheduled requests indicates there's a bottleneck in satisfying client requests. The Max Req column shows that SQL Anywhere's "AutoMultiProgrammingLevel" has been adjusting the maximum number of tasks that can be active (Max Req is currently 22) but there's a serious backlog (Unsch Req 73).
Figure 5. The Monitor Page For A Busy Database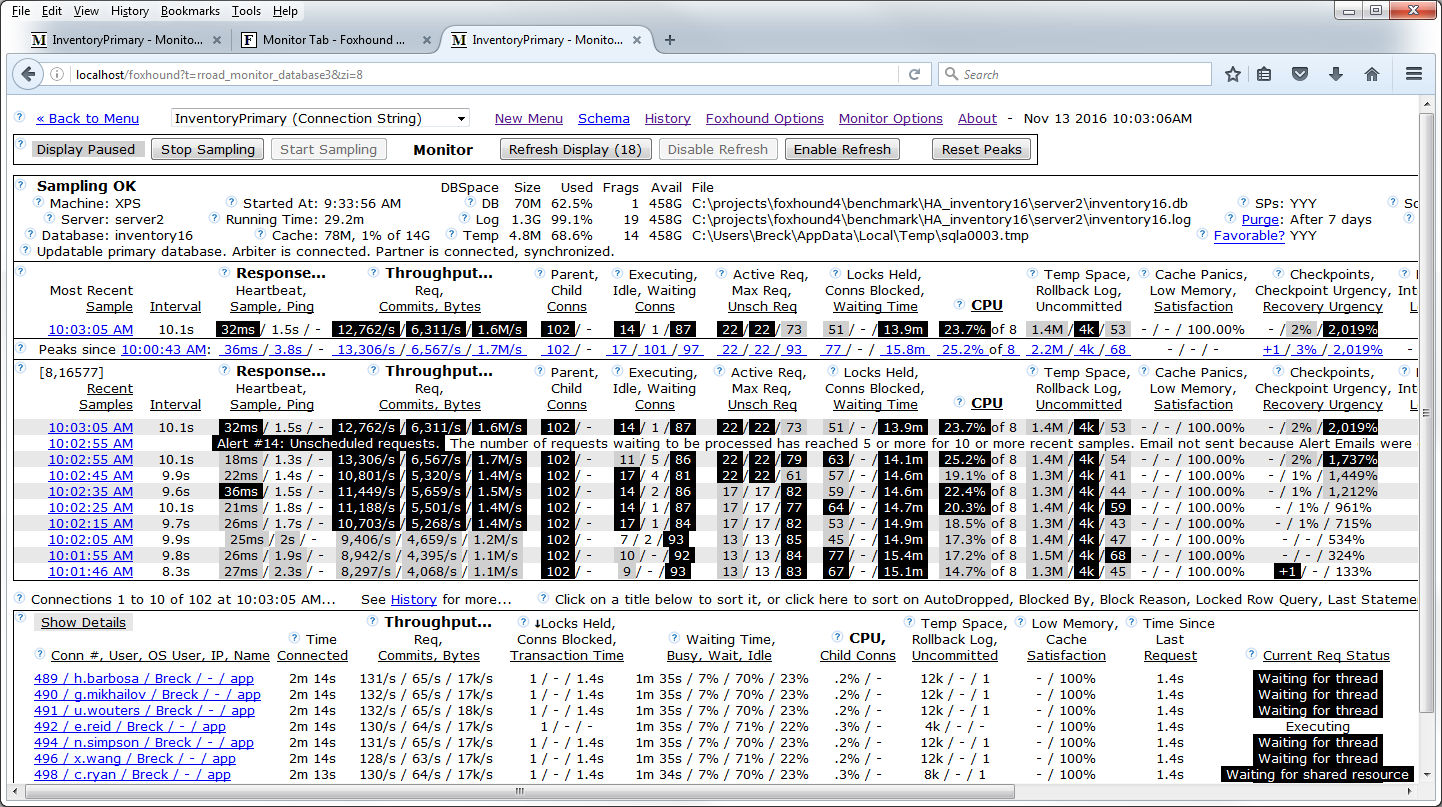
The Monitor page is filled with hypertext links, most of them opening new tabs showing historical data:
Sample History and Connection History pages are described in the next two sections.
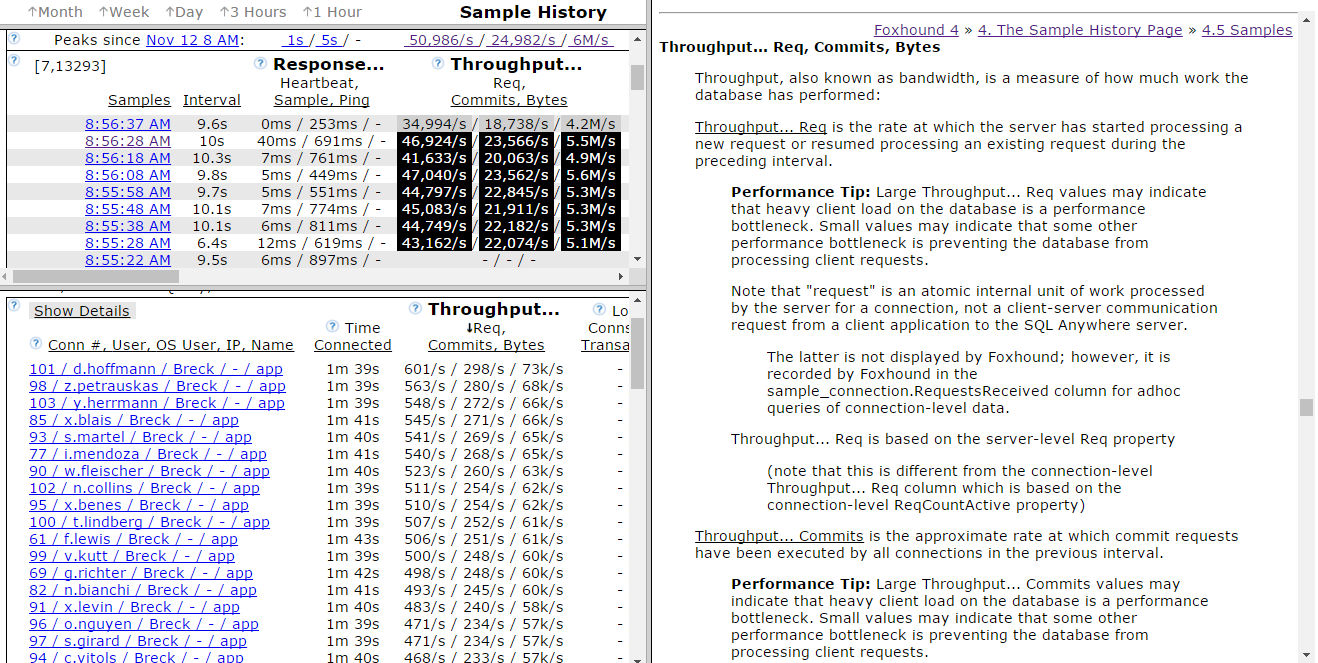
Figure 6 shows the same server as Figure 5, this time using the Sample History page which
Figure 6. The Sample History Page For The Same Busy Database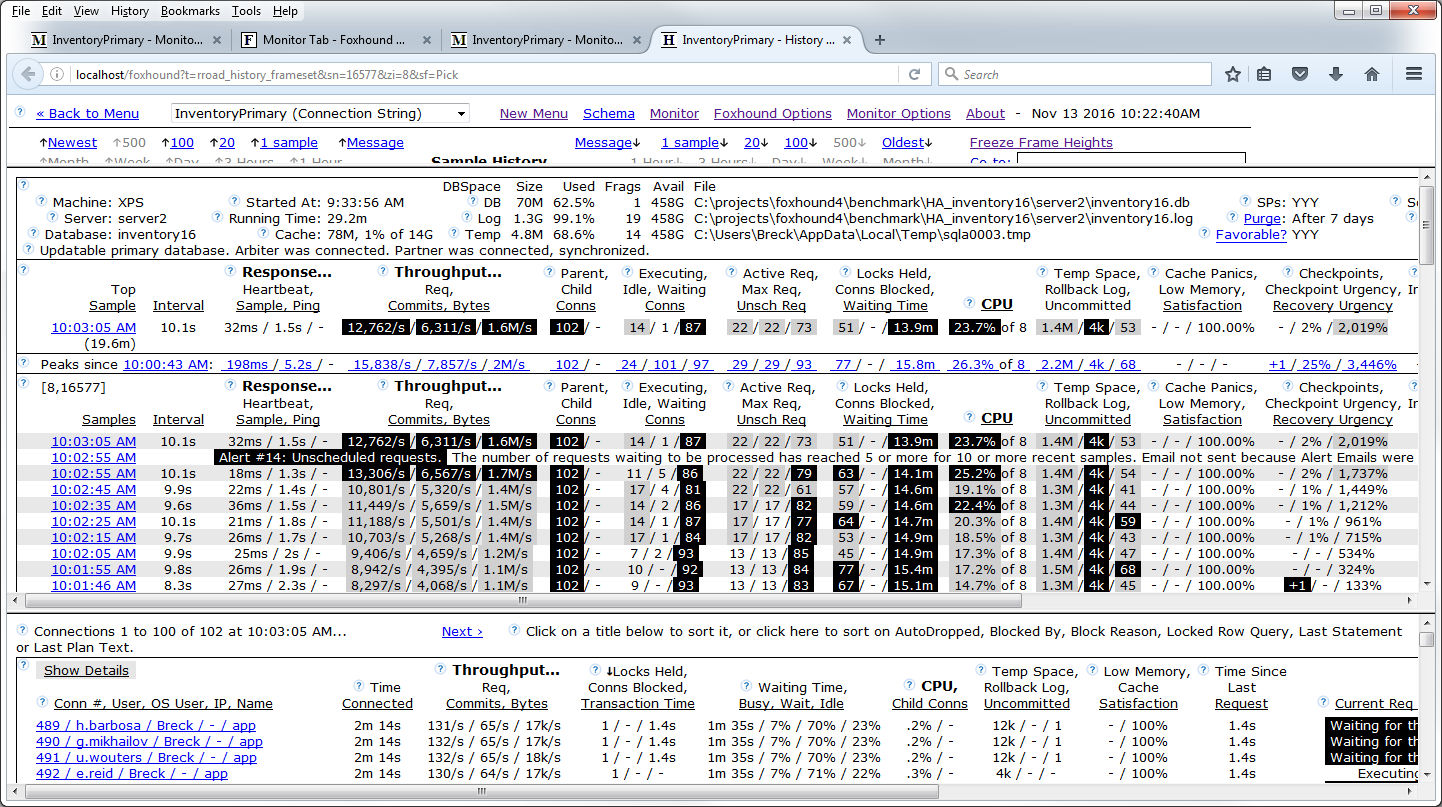
The connection links like 489 / h.barbosa / Breck / - / app open a Connection History page for the selected connection in a new tab. This "drill down" view is shown in the next section.
Figure 7 shows yet another view of the busy server in Figures 5 and 6. The Connection History page shows the history of performance statistics for one single connection over time. A snapshot of the most recent server and database statistics is included at the top of the page, but the rest of the page is devoted to that one connection.
Figure 7. The Connection History Page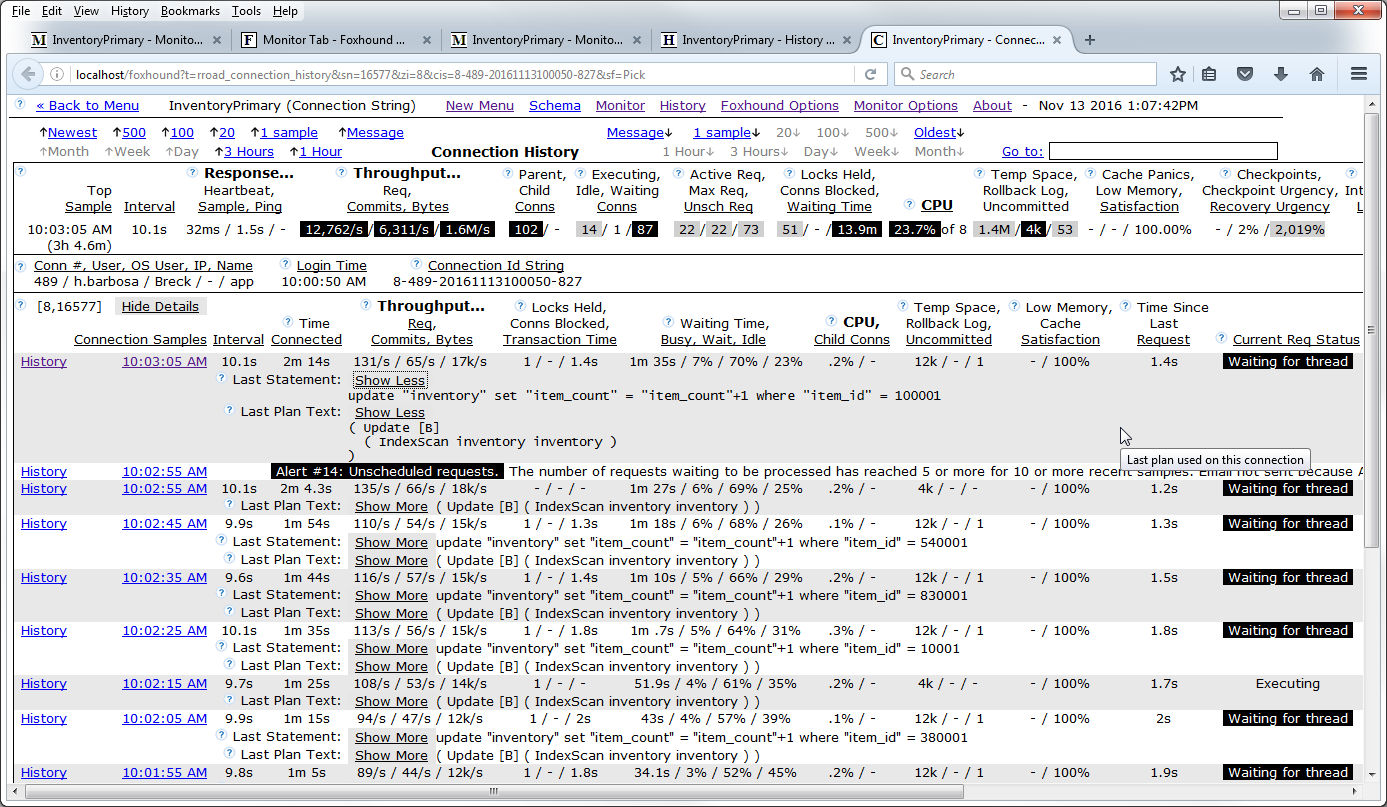
Alert messages are displayed Connection History even when they have nothing to do with connection being displayed because it's always important to know what's going on.
Each History link opens a Sample History page in a new tab, positioned to the same sample, in effect returning to the "big picture" view shown in the previous section.
Figure 8 shows an Alert email for a connection that has violated a strict limit placed on the amount of temporary space a single connection can use; in this case, 100M for 3 or more samples (about 30 seconds).
The email subject line is a highly condensed summary:
What happened? Alert #22 Conn temp file usage Where did it happen? Inventory Where exactly was that? Machine XPS, Server inventory16_xps, Database inventory16
As well as describing this Alert, the body of the email contains a list of recent alerts for this database and a snapshot of the Monitor page when this Alert was issued.
Figure 8. An Alert Email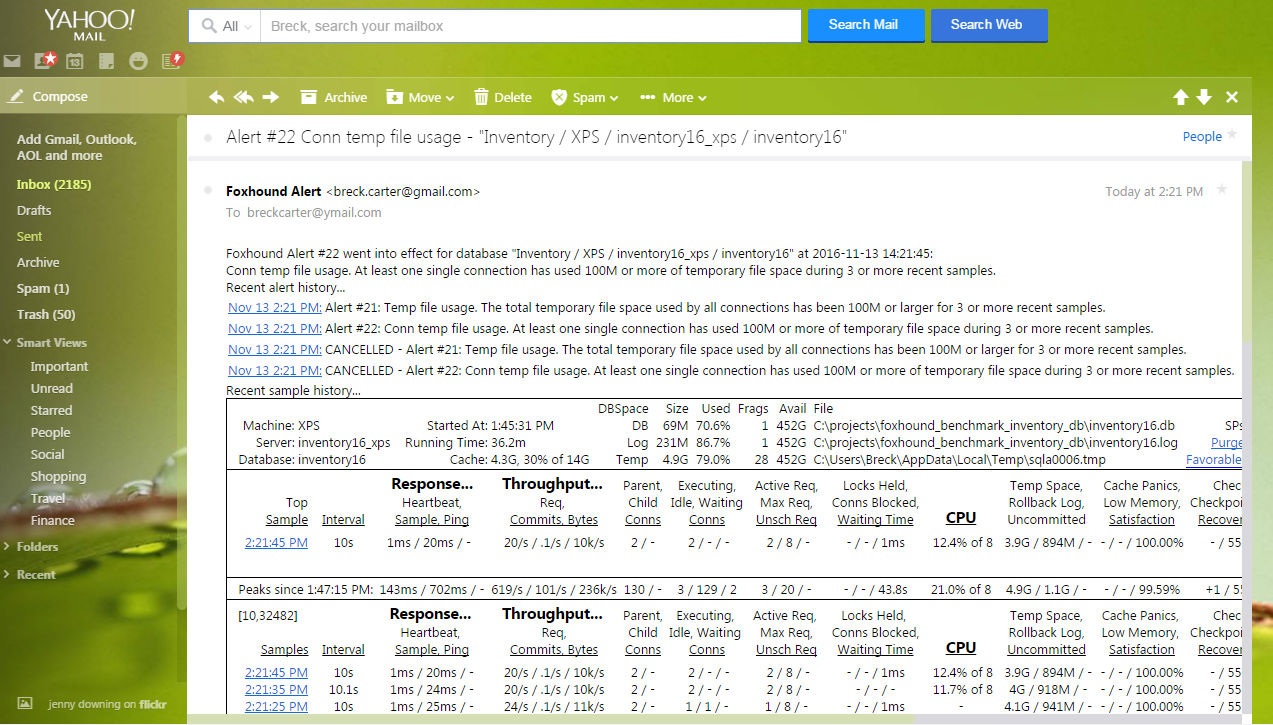
Tip: If Gmail doesn't display your Alert messages properly, try another client like Ymail.
Tip: If Google's SMTP server doesn't let you send Foxhound Alert messages, try another server like SendGrid.
Table 2. Default Alert Criteria
1 Database unresponsive Foxhound has been unable to gather samples for [1m] or longer. 2 Long heartbeat The heartbeat time has been [1s] or longer for [10] or more recent samples. 3 Long sample time The sample time has been [10s] or longer for [10] or more recent samples. 4 CPU usage The CPU time has been [90]% or higher for [10] or more recent samples. 5 Database disk space The free disk space on the drive holding the main database file has fallen below [1G]. 6 Temp disk space The free disk space on the drive holding the temporary file has fallen below [1G]. 7 Log disk space The free disk space on the drive holding the transaction log file has fallen below [1G]. 8 Other disk space The free disk space on one or more drives holding other database files has fallen below [1G]. 9 Arbiter unreachable The high availability target database has become disconnected from the arbiter server. 10 Partner unreachable The high availability target database has become disconnected from the partner database. 11 ServerName change The real server name has changed to [server2], possibly because of an HA failover or OnDemand move. 13 File fragmentation There are [1,000] or more fragments in the main database file. 14 Unscheduled requests The number of requests waiting to be processed has reached [5] or more for [10] or more recent samples. 15 Incomplete I/Os The current number of incomplete file reads and/or writes has reached [2] or more for [10] or more recent samples. 16 I/O operations There have been [1,000] or more disk and log I/O operations per second for [10] or more recent samples. 17 Checkpoint urgency The Checkpoint Urgency has been [100]% or more for [10] or more recent samples. 18 Recovery urgency The Recovery Urgency has been [1,000]% or more for [10] or more recent samples. 19 Cache size The cache has reached [100]% of its maximum size for [10] or more recent samples. 20 Cache satisfaction The cache satisfaction (hits/reads) has fallen to [90]% or lower for [10] or more recent samples. 21 Temp file usage The total temporary file space used by all connections has been [1G] or larger for [10] or more recent samples. 22 Conn temp file usage At least one single connection has used [512M] or more of temporary file space during [10] or more recent samples. 23 Blocked connections The number of blocked connections has reached [10] or more during [10] or more recent samples. 24 Conn blocking others At least one single connection has blocked [5] or more other connections during [10] or more recent samples. 25 Locks The number of locks has reached [1,000,000] or more during [10] or more recent samples. 26 Connections The number of connections has reached [1,000] or more for [10] or more recent samples. 27 Connection CPU The approximate CPU time has been [25]% or higher for at least one connection during [10] or more recent samples. 28 Long transaction The transaction running time has reached [1m] or more for at least one connection during [10] or more recent samples. 29 Cache panics There have been [1] or more cache panics per second for [10] or more recent samples. 30 Database read-only The target database has changed from accepting updates to read-only processing. 31 Database updatable The target database has changed from read-only processing to accepting updates. 32 Rollback log usage The total rollback log space used by all connections has been [1G] or larger for [10] or more recent samples. 33 Uncommitted operations The total number of uncommitted operations for all connections has reached [1,000,000] or more during [10] or more recent samples. 34 Long uncommitted The number of uncommitted operations has reached [1,000,000] or more while the transaction running time has reached [1m] or more for at least one connection. 35 Separate ping failed Foxhound has been unable to make a separate ping connection to the target database for [10] or more recent samples.
For every target database being monitored by Foxhound, four separate schedules may be created to turn specific features on and off in 15-minute intervals over a 7-day week:
Figure 9. Sample Schedule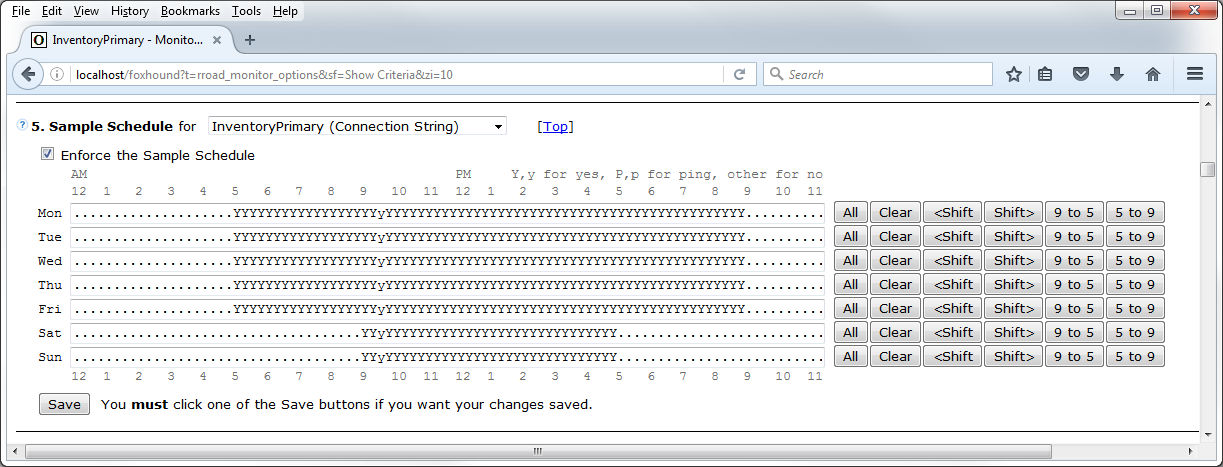
New in Foxhound 4: Drop-down list boxes let you switch among different target databases on the Monitor Options page (shown above) as well as on the Monitor and Sample History pages.
Figure 10 shows a single database connection that is using up all the CPU time (92% of 8 processors). The Parent, Child Conns column shows there are 3 external database connections and 8 internal child connections, and the connections frame at the bottom of the page shows that connection 5 is the external connection responsible for creating all 8 internal connections named "INT: EXCHANGE". The Last Plan Text field shows why: SQL Anywhere's intra-query parallelism feature is in full force with all 8 processors devoted to performing a "Parallel Index-Only Scan".
In this case, the details of the "why" may not be as important as the "what": Connection 5 is a runaway. A quick solution might be to drop connection 5, and Foxhound's AutoDrop feature can be used to automate that solution. Another solution might be to "turn down the volume" on the intra-query parallelism feature by setting the MAX_QUERY_TASKS database option to something other than "all processors"; e.g., 4, or even 1 to turn it off altogether. Other solutions might be to change the query to be less aggressive, or schedule it in off-peak hours.
Figure 10. Runaway Connection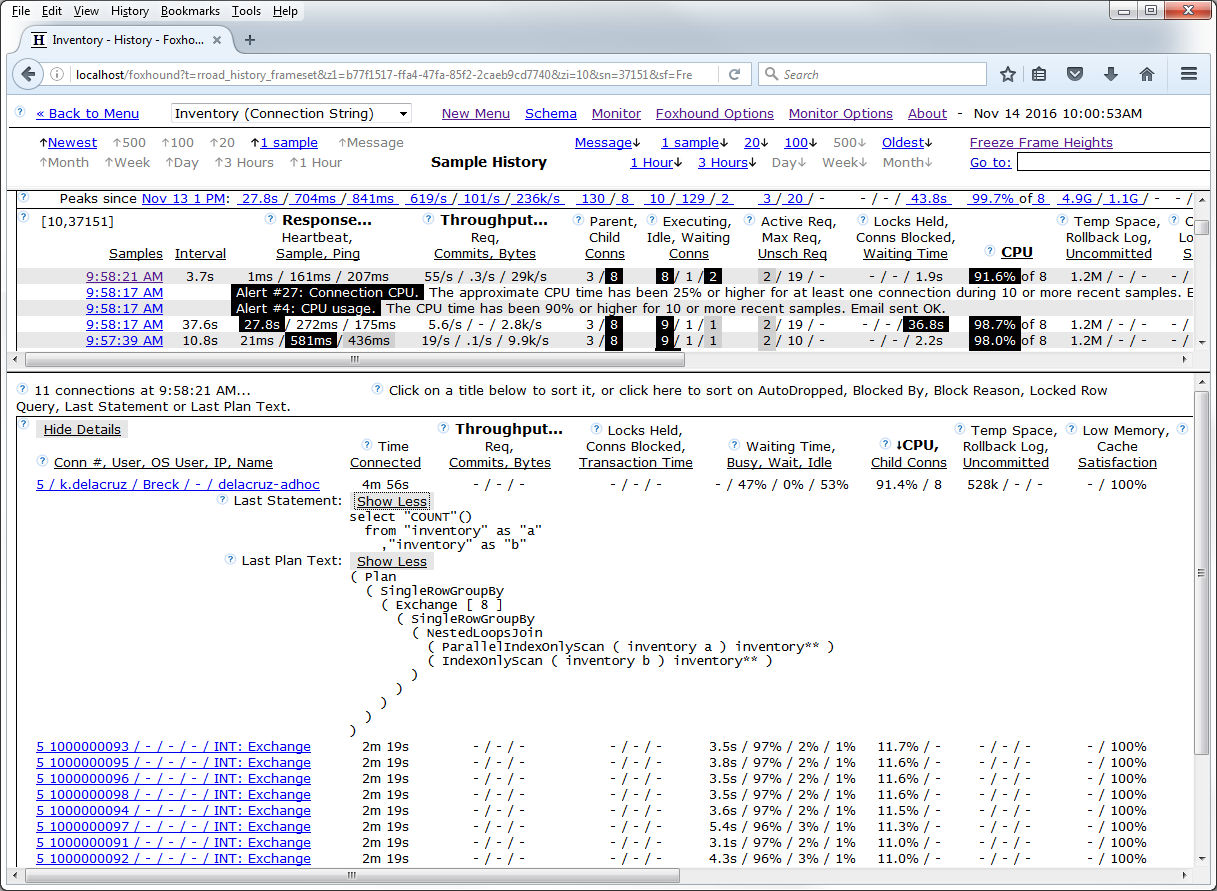
Tip: The CPU percentages are a prime example of Foxhound's value-added calculations where Foxhound displays child connections together with their parents and adjusts the CPU percentages so they make sense.
Figure 11 shows a SQL Anywhere 16 server that is behaving erratically in the face of a steady load:
The Alert #22 reveals the culprit: A single connection that is consuming Temp Space at a great rate, causing great difficulties for the other 100 connections that are trying to get something done. The other values (CPU usage, response time, etc) aren't the problem, they're symptoms of runaway Temp Space usage.
Figure 11. Runaway Memory Usage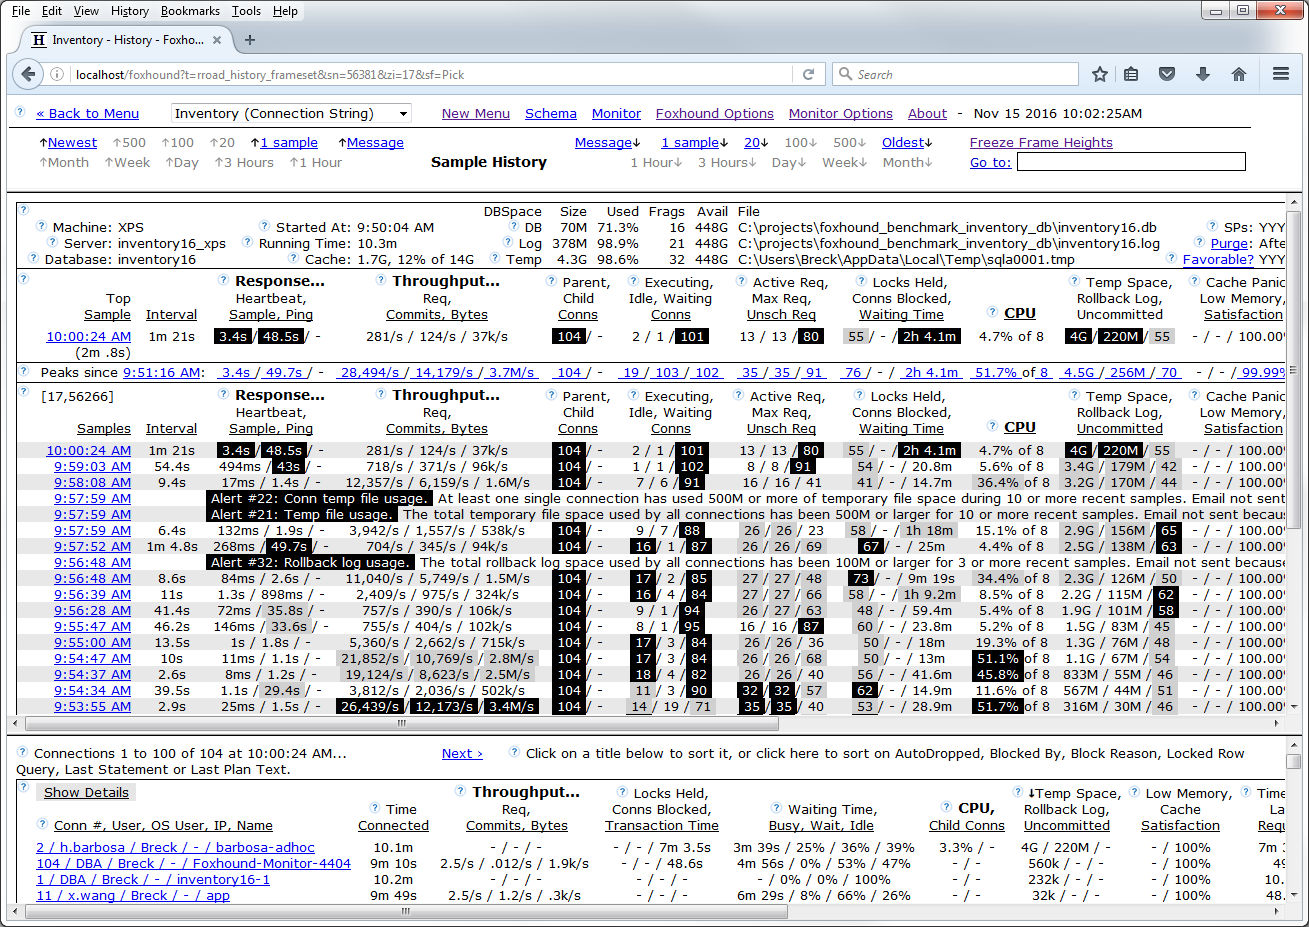
Tip: The Connections section at the bottom of Figure 11 shows what happens when you click on the "Temp Space" column title to bring "2 / h.barbosa / Breck / - / barbosa-adhoc" to the top. You can do this with any of the Connections columns on the Monitor and Sample History pages.
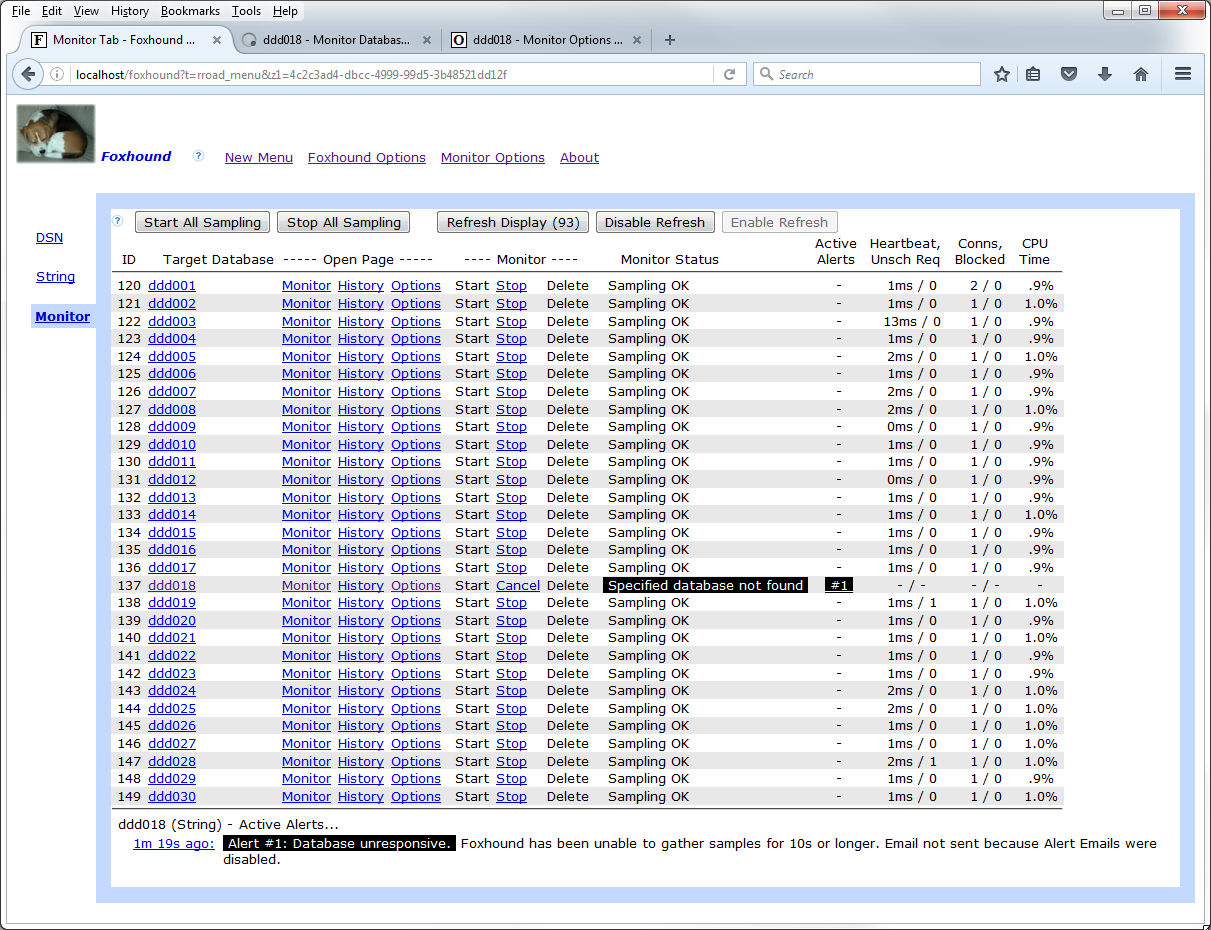
SQL Anywhere makes it easy to deploy large numbers of separate database servers on the same and different computers, each one running multiple databases. Foxhound deals with large deployments in a number of ways:
Figure 12. The Monitor Tab on the Foxhound Menu Page